|
|
Research Areas My research focuses on data visualization, human-computer interaction and computer graphics.
Some current research projects:
- Urban and Social Media Visualization
- Graph, Social Network, and High-Dimensional Data Visualization
- E-Learning
Research topics before 2009:
My research has advanced the
state-of-the-art in intuitive volume visualization and clutter reduction in
parallel coordinates and graphs, and also addressed some new problems from
the real-world applications such as air pollution analysis.
- Scientific Visualization

- Information Visualization

- Visual Analytics

- Computer Graphics

Intuitive and
effective volume visualization
Volume visualization is a
major research topic in scientific visualization. Volume rendering,
especially direct volume rendering, has been heavily investigated in the
visualization field since the 1980s. Direct volume rendering is the most
powerful and flexible volume visualization technique. However, it is still
not widely used in practice. Thus, my research focuses on improving the
usability of direct volume rendering, especially its intuitiveness,
effectiveness, and efficiency. Our target users are doctors, scientists, and
engineers who do not have the expertise on transfer function design. The works we have done include:
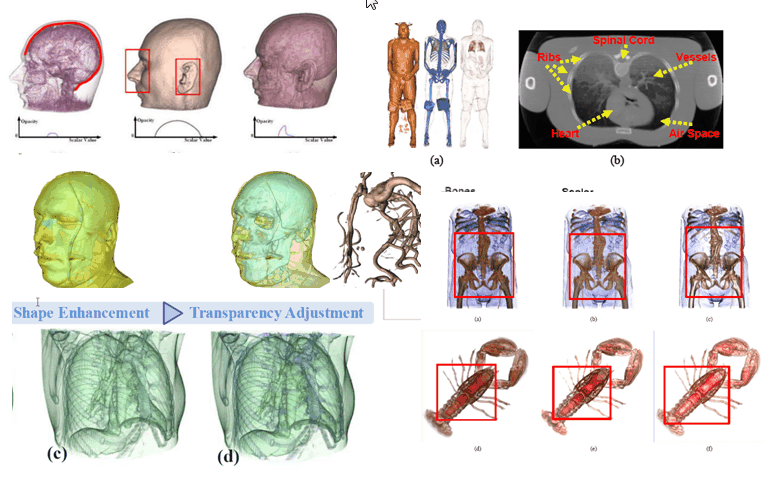
- An editing
framework for direct volume rendered images. We found that doctors
are more interested in working on images, especially slices. Thus, we
developed a novel method which allows end-users to directly edit
volume rendered images. The
work was first presented as a poster at the IEEE Visualization 2006,
which was nominated for the Best Poster Award. The extended version
was published in the IEEE Transactions on Visualization and Computer
Graphics 2007 [12].
- Automatic
quality enhancements of direct volume rendered images. I believe
that volume rendering engines are just like cameras. No matter how
perfect the design is, there will always be some problems with the
final rendered images. Thus, we developed a set of automatic
enhancement tools for direct volume rendered images. The first tool is
called quality enhancement. The work was published in Volume Graphics
2007 and featured in the cover of the proceedings. The second tool is called
perception-based transparency optimization. The work has been accepted to the IEEE
Visualization 2009 and published in the IEEE Transactions on
Visualization and Computer Graphics [4].
- Relation-aware
volume exploration pipeline. Spatial relation is one of the most
important features in volumetric data. Direct volume rendering is a
very effective way to reveal spatial relations between structures.
However, the relation revealed in the direct volume rendered images
may be ambiguous or even misleading. To address this problem, we
proposed a relation-aware exploration pipeline for volumetric
datasets. This work was
presented at the IEEE Visualization 2008 and published in the IEEE
Transactions on Visualization and Computer Graphics [8].
- General
effectiveness metrics for volume rendering. One major issue facing
direct volume rendering is how to evaluate the effectiveness of the
rendering results. Two traditional ways to validate visualization
techniques are the expert reviews and user studies. However, these
methods are mainly for experts to improve their systems. We believe that
some built-in automatic effectiveness metrics will be very useful for
end users. Similar to the built-in grammar and style checking in the Microsoft
Word, our effectiveness metrics can automatically alert users on some
ambiguous or misleading information in the rendered images or the visualization
process. We propose four metrics, namely visibility metric,
distinguishability metric, contour clarity metric, and coherence
metric for the typical volume visualization systems. The preliminary
result appeared in a poster at the IEEE Visualization 2007, which was
nominated for the Best Poster Award. A journal version with an
extensive user study is currently in preparation.
Impacts
These four
methods can dramatically improve the usability of volume visualization
systems. They fit our vision that the future volume visualization system
should be intuitive and safe to use, and the effectiveness of the
visualization process will be automatically checked. Our research will
facilitate a wider adoption of volume rendering in practice, which will
benefit the end users of the visualization systems, such as physicians,
engineers, and scientists.
Clutter reduction for
parallel coordinates and graphs
Parallel coordinates and
graphs are the most widely used information visualization techniques for
multi-variate data and relational data analysis. However, visual clutter is
a major problem. When there are too many data items, the display will
become visually cluttered and the underlying patterns cannot be revealed.
We proposed a novel scheme called visual clustering to reduce visual
clutter and reveal underlying patterns for graphs and parallel coordinates.
Our works include:
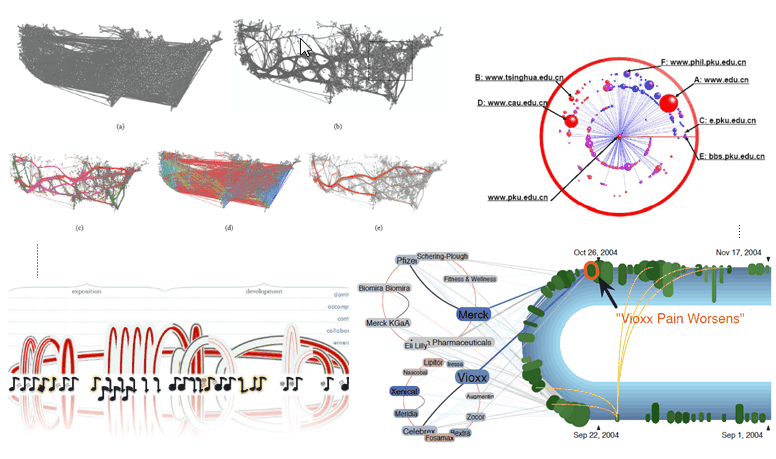
- Edge
bundling for general graphs. Bundling edges together can
dramatically improve the layout of graphs. However, previous edge
bundling methods can only work for some special graphs. We proposed
the first edge bundling framework for general graphs. Our method is
original and based on control meshes. Our controllable and progressive
edge clustering scheme was first published in Graph Drawing 2006, the
top conference in the graph drawing area. An extended version with better
mesh generation and advanced visualization techniques was presented at
the IEEE Symposium on Information Visualization 2008 and published in the
IEEE Transactions on Visualization and Computer Graphics 2008 [9]. An
energy-based approach for edge bundling was presented in the IEEE
Pacific Visualization Symposium 2008.
- Visual
clustering and splatting for parallel coordinates. The traditional way to reduce
visual clutter in parallel coordinates is brushing (i.e., filtering).
Some pre-clustering in the data domain can also be used. However, some
information will be lost. We proposed to use visual clustering to
reduce visual clutter. Compared with brushing and pre-clustering,
visual clustering can enhance and reveal interesting patterns in the
data while preserving the context. Our process does not filter out any
information. Instead, clusters are enhanced by visually bundling them
together in the display. We developed two techniques, the energy-based
clustering in the visual domain and the splatting-based clustering in the
time domain. The first technique was presented at the EuroVis’08 [10] while
the second approach was presented at the EuroVis’09 [7].
- Combining
scatter plots and parallel coordinates. Scatter plots can show the
correlation between two variables while the distributions of data
values in high dimensional space can only be fully revealed in parallel
coordinates using polylines. They all have their advantages and disadvantages.
Multi-dimensional scaling can use points projected onto a 2D plane to show
the clusters in the high dimensional space. Thus, we developed an original
framework to combine points and polylines via multi-dimensional
scaling. This work has been accepted to the IEEE Information
Visualization Symposium and will be published in the IEEE Transactions
on Visualization and Computer Graphics [5].
Impacts Parallel coordinates and graphs are two
cornerstone visual representations in information visualization. Our visual
clustering scheme is novel and shows great potential. We will further
pursue this line of research and investigate the differences between visual
clustering in the display domain and traditional clustering in the data
domain. Our research makes parallel coordinates and graphs more effective
at revealing patterns in multi-variate data and relational data. We are
currently applying our techniques in several visual data mining projects
such as mining trajectory data.
Visual analytics and
new problems from the real world applications
Visualization is a highly
application-driven field and I have always paid special attention to some
important problems from the real world. We have creatively applied and
extended some established visualization techniques to solve these problems.
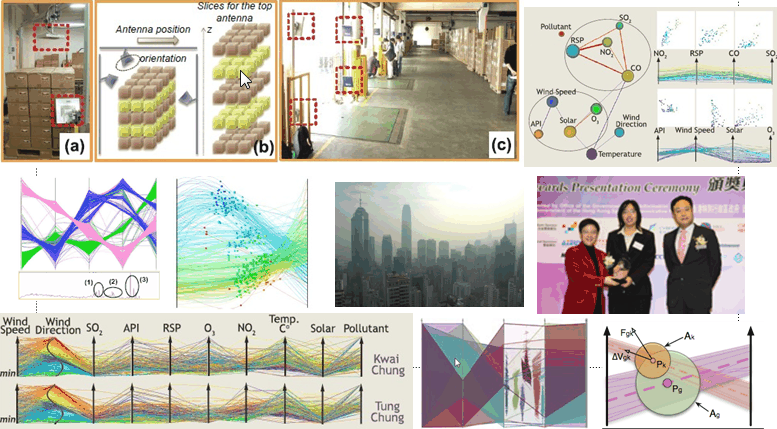
- Visual analysis
of the air pollution problem in Hong Kong. The air quality problem
in Hong Kong has aroused much attention recently. The Hong Kong
government has established 18 observation stations, and the weather
and air quality data are collected hourly. Some patterns of the air
pollution problem have been revealed but some high level correlations
are still elusive. Thus, we teamed up with the domain scientists from
the Institute of Environments at HKUST to address this problem. We
developed some novel visualization techniques such as the S-shape axis
for parallel coordinates and integrated them into a comprehensive
system for air pollution analysis. Our system is the first system
developed especially for air pollution analysis. Our work has been widely
recognized. The paper was presented at the IEEE Visualization 2007 and
published in the IEEE Transactions on Visualization and Computer
Graphics [11]. The basic system has won the HKICT Best Innovation Award
in 2007. An RGC grant has been awarded to further improve the system.
- Interactive
visual optimization and analysis for RFID benchmarking. RFID
devices such as transportation cards and intelligent IDs have been
widely used in the industry sector. Hong Kong has the world’s first
major public transport system using the RFID technology. RFID has also
been used in the logistic and supply chain management in Hong Kong. However,
to successfully deploy such systems, benchmarking is required. HKUST has
pioneered an α-gate system for RFID benchmarking. The system has
been commercialized and has won an industrial award. However, the
benchmarking results in a large amount of complex spatial temporal
data. Manually analyzing these datasets will be very time consuming.
Thus, we teamed up with a domain scientist to solve this problem. This
work will be presented at the IEEE Visualization 2009 and published in
the IEEE Transactions on Visualization and Computer Graphics [3].
- Visualizing
the semantic structures of classic music works. My student Wing-Yi
Chan took a music theory class during her last year of UG study.
However, she found that it was difficult to understand the semantic structures
in classical music works through the traditional ways such as essays
and scores. She wanted to apply information visualization techniques
to analyze the macro-relationships among layers, the micro-relationships
of theme occurrences, and the macro-micro relationships between layer
roles and theme variations. I closely worked with her and finally we
developed a system which can reveal the beauty and sophistication of
classical music works. The paper has been accepted to the IEEE
Transactions on Visualization and Computer Graphics [2].
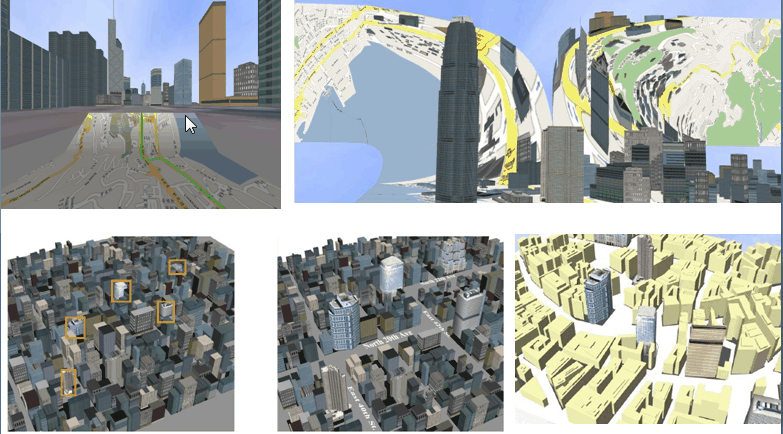
- Focus+Context
zooming and information overlay in 3D urban environments. With the rapid development of
3D modeling and rendering technologies, it is now possible to model a
whole city and then show them to users via Google Earth or Microsoft
Bing Maps 3D. This opened doors to many applications, especially for tourists
to virtually explore a city and plan their tours. A very common task that
users often conduct in a 3D urban environment is to find a route from
one building to another. We proposed a novel route zooming technique
which creatively applied the seam carving algorithm and grid-based
scaling to 3D urban environments. The method can provide seamless
focus+context zooming to help users visualize a route with minimum
distortions. It also provides occlusion-free information overlay such
that some information (e.g., air pollution and other annotations) can
be conveniently overlaid to the 3D urban environments. The work will
be presented at IEEE Visualization 2009 and will be published in the IEEE
Transactions on Visualization and Computer Graphics [1]. One image
from the paper has been chosen for the front cover of the TVCG:
Vis/InfoVis special journal issue.
Impacts Applications from the real world provide
both challenges and opportunities for our field. Thus, I spend much effort and
time talking with people in different fields and looking for promising
applications. I am quite happy with the results. Our air pollution project with
the Institute of Environment at HKUST has high potential because air
pollution is a very serious problem in many regions and our system has been
highly evaluated by the domain scientists. Our route zooming technique can
also be used by Google Earth or Microsoft Bing Maps 3D to benefit a wider
audience. Our music visualization system has received highly positive
feedback from music students and experts. They believe it may change the
way people learn classic music structures. From these applications, we have
also identified some general research problems. For example, we found that the
macro/micro relations among the layers and themes in classical music works
also exist in many other types of data such as news streams. We are
currently investigating the visualization techniques to address this research
problem.
Representative
Publications:
(The
names of my students are underlined.)
1.
Huamin Qu, Haomian Wang, Weiwei Cui, Yingcai Wu, Ming-Yuen Chan. “Focus+Context Route Zooming and
Information Overlay in 3D Urban Environments”, IEEE Transactions on Visualization and Computer Graphics (Proceedings
Visualization / Information Visualization 2009), vol. 15, no. 6, Nov.-Dec. 2009. (Cover Image)
2.
Wing-Yi
Chan, Huamin Qu,
Wai-Ho Mak. "Visualizing
the Semantic Structure in Classical Music Works", IEEE Transactions on Visualization and
Computer Graphics, accepted for publication.
3.
Yingcai
Wu, Ka-Kei
Chung, Huamin
Qu, Xiaoru Yuan, Shing-Chi Cheung. “Interactive Visual Optimization and
Analysis for RFID Benchmarking, IEEE Transactions on Visualization and Computer Graphics (Proceedings
Visualization / Information Visualization 2009), vol. 15, no. 6, Nov.-Dec. 2009.
4.
Ming-Yuen
Chan, Yingcai
Wu, Wai-Ho
Mak, Wei Chen,
Huamin Qu. “perception-Based Transparency Optimization for Direct Volume Rendering”.
IEEE Transactions on
Visualization and Computer Graphics (Proceedings Visualization /
Information Visualization 2009), vol.
15, no. 6, Nov.-Dec. 2009.
5.
Xiaoru Yuan, Peihong Guo, He Xiao, Hong
Zhou, Huamin Qu. “Scattering
Points in Parallel Coordinates”, IEEE
Transactions on Visualization and Computer Graphics (Proceedings
Visualization / Information Visualization 2009), vol. 15, no. 6, Nov.-Dec. 2009.
6.
Wei Chen, Zi’ang Ding, Song Zhang, Anna M.
Brandt, Stephen Correia, Huamin Qu, John A. Crow, David Tate, Zhicheng Yan,
Qunsheng Peng. “A Novel Interface for Interactive Exploration of DTI
Fibers”, IEEE Transactions on
Visualization and Computer Graphics (Proceedings Visualization /
Information Visualization 2009), vol.
15, no. 6, Nov.-Dec. 2009.
7.
Hong
Zhou, Weiwei
Cui, Huamin Qu,
Yingcai Wu, Xiaoru
Yuan, Wei Zhuo. “Splatting
the Lines in Parallel Coordinates”, Computer
Graphics Forum (Proceedings of EuroVis'09), vol. 28. no.3, pages 759
– 766, 2009. (Cover Image)
8.
Ming-Yuen Chan, Huamin Qu, Ka-Kei Chung, Wai-Ho Mak, and Yingcai Wu, "Relation-Aware Volume
Exploration Pipeline", IEEE Transactions on Visualization and Computer
Graphics (Proceedings Visualization / Information Visualization 2008), vol.
14, no. 6, pages 1683-1690, Nov.-Dec. 2008.
9.
Weiwei Cui, Hong Zhou, Huamin
Qu, Pak Chung Wong, and Xiaoming Li, "Geometry-Based Edge Clustering
for Graph Visualization", IEEE Transactions on Visualization and
Computer Graphics (Proceedings Visualization / Information Visualization
2008), vol. 14, no. 6, pages 1277-1284, Nov.-Dec. 2008. (Cover Image)
10. Hong
Zhou, Xiaoru Yuan, Huamin Qu, Weiwei Cui, Baoquan Chen.
"Visual Clustering in Parallel Coordinates", Computer Graphics
Forum (Proceedings of EuroVis'08), vol. 27, no. 3, 2008.
11. Huamin Qu, Wing-Yi Chan, Anbang
Xu, Kai-Lun Chung, Kai-Hon Lau, Ping Guo. "Visual Analysis of The Air
Pollution Problem in Hong Kong", IEEE Transactions on Visualization
and Computer Graphics (Proceedings of Visualization / Information
Visualization 2007), vol. 13, no. 6, Nov.-Dec. 2007.
12. Yingcai Wu, Huamin Qu. “Interactive Transfer
Function Design Based on Editing Direct Volume Rendered Images”, IEEE
Transactions on Visualization and Computer Graphics, Vol. 13, No.5, pp.
1027—1040, 2007.
13. Ming-Yuen Chan, Yingcai
Wu, and Huamin Qu.
"Quality Enhancement of Direct Volume Rendered Images", 6th
IEEE/EG International Symposium on Volume Graphics (VG'07), pp. 25 – 32,
2007. (Cover Image)
14. Huamin Qu, Hong Zhou, Yingcai Wu.
“Controllable and Progressive Edge Clustering for Large Networks”, 14th International Symposium on Graph
Drawing (GD’06), pp. 399 – 404, Karlsruhe, Germany, September 18 - 20,
2006.
|